
| [ < ] | [ > ] | [ << ] | [ Up ] | [ >> ] | [Top] | [Contents] | [Index] | [ ? ] |
1.4.3 Color scheme
The color scheme is used for determining the color of surfaces, isolines, isosurfaces and so on. The color scheme is defined by the string which may contain several characters that are color id (see section mglColor class or see section Line styles) or characters ‘d#:|’. Symbol ‘d’ denotes interpolation by 3d position instead of the coloring by amplitude. Symbol ‘#’ switch to mesh drawing or to wire plot. Symbol ‘|’ disable color interpolation in color scheme which can be usefull, for example, for sharp colors during matrix plotting. Symbol ‘:’ finishes the color scheme parsing. After it the user may put styles for text, rotation axis for curves/isolines and so on. Color scheme may contain up to 32 color values.
Also you may use “lighted” colors in color scheme specification (not in line style!). The “lighted” color contain 2 symbols: first one is usual symbol for color specification, second one is digit for its brightness. The digit can be in range ‘1’...‘9’. At this ‘5’ correspond to normal color, ‘1’ is very dark version of the color (practically black), ‘9’ is very bright version of the color (practically white).
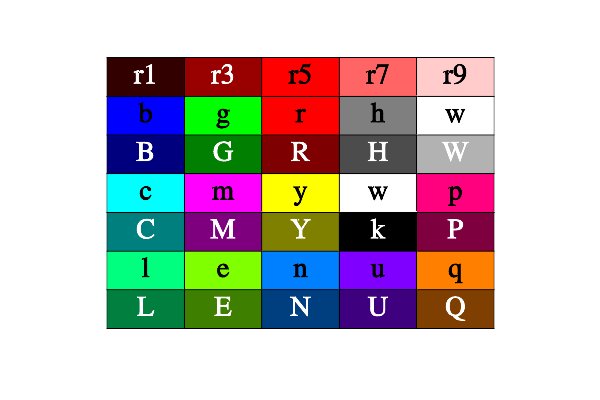
Colors and its ids.
For coloring by amplitude (most common) the final color is linear interpolation of color array. The color array is constructed from the string ids. The argument is the amplitude normalized between Cmin – Cmax (see section Ranges (bounding box)). For example, string containing 4 characters ‘bcyr’ corresponds to colorbar from blue (lowest value) through cyan (next value) through yellow (next value) to the red (highest value). String ‘kw’ corresponds to colorbar from black (lowest value) to white (highest value). String ‘m’ corresponds to a simple magenta color.
There are several useful combinations. String ‘kw’ corresponds to the simplest gray color scheme when higher values are brighter. String ‘wk’ presents the inverse gray color scheme when higher value is darker. Strings ‘kRryw’, ‘kGgw’, ‘kBbcw’ present well-known hot, summer and winter color schemes. Strings ‘BbwrR’ and ‘bBkRr’ allow to view bicolor figure on white or black background when negative values are blue and positive values are red. String ‘BbcyrR’ gives color scheme similar to well-known jet color scheme.
Examples of the most popular color schemes:
- ‘kw’

- ‘wk’

- ‘hHCcw’

- ‘kRryw’

- ‘kGgew’

- ‘kBbcw’

- ‘BbwrR’

- ‘BbwgG’

- ‘GgwmM’

- ‘bcwyr’

- ‘QqwcC’

- ‘CcwyY’

- ‘BbcyrR’

- ‘BbcwyrR’

- ‘bwr’

- ‘bcyr’

- ‘bgr’

- ‘BbcyrR|’

For the coloring by coordinate the final color is determined by position of the point in 3d space and is calculated by formula c=x*c[1] + y*c[2] + z*c[3]. Here c[1], c[2], c[3] are the first three elements of color array; x, y, z are normalized to Min – Max coordinates of the point. This type of coloring is useful for isosurface plot when color may show the exact position of the peace of surface. For example, see section Surf3.
Also you may use “lighted” colors in color scheme specification (not in line style!). The “lighted” color contain 2 symbols: first one is usual symbol for color specification, second one is digit for its brightness. The digit can be in range '1'...'9'. At this ‘5’ correspond to normal color, ‘1’ is very dark version of the color (practically black), ‘9’ is very bright version of the color (practically white). For example, the color scheme can be ‘b2b7wr7r2’.
| [ < ] | [ > ] | [ << ] | [ Up ] | [ >> ] | [Top] | [Contents] | [Index] | [ ? ] |