
| [ < ] | [ > ] | [ << ] | [ Up ] | [ >> ] | [Top] | [Contents] | [Index] | [ ? ] |
29.1.1 Plotting the Triangulation
Octave has the functions triplot and trimesh to plot the
Delaunay triangulation of a 2-dimensional set of points.
- Function File: triplot (tri, x, y)
- Function File: triplot (tri, x, y, linespec)
- Function File: h = triplot (…)
Plot a triangular mesh in 2D. The variable tri is the triangular meshing of the points
(x, y)which is returned fromdelaunay. If given, the linespec determines the properties to use for the lines. The output argument h is the graphic handle to the plot.
- Function File: trimesh (tri, x, y, z)
- Function File: h = trimesh (…)
Plot a triangular mesh in 3D. The variable tri is the triangular meshing of the points
(x, y)which is returned fromdelaunay. The variable z is value at the point(x, y). The output argument h is the graphic handle to the plot.
The difference between triplot and trimesh is that the
former only plots the 2-dimensional triangulation itself, whereas the
second plots the value of some function f (x, y).
An example of the use of the triplot function is
rand ("state", 2)
x = rand (20, 1);
y = rand (20, 1);
tri = delaunay (x, y);
triplot (tri, x, y);
|
that plot the Delaunay triangulation of a set of random points in 2-dimensions. The output of the above can be seen in fig:triplot.
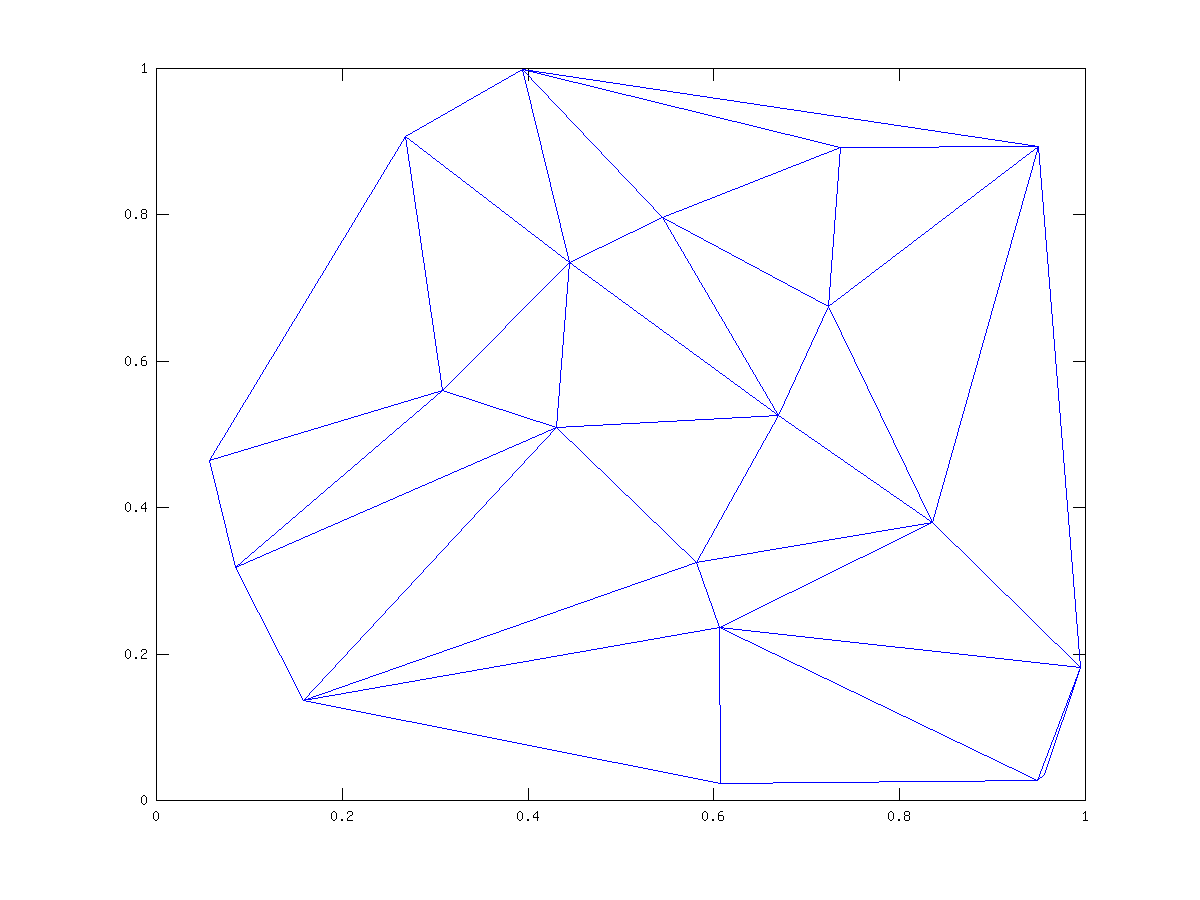
Figure 29.1: Delaunay triangulation of a random set of points